Not signed up to our monthly newsletter? You can sign up for free here.
Dilated cardiomyopathy (DCM) is defined by a dilated and impaired left ventricle. The right ventricle may or may not be affected. This is a primary disease of the heart muscle, so if it is secondary to any other cause (such as valvular disease, chronic left ventricular outflow tract obstruction or congenital heart disease), it is not true DCM. Dilated cardiomyopathy is therefore a diagnosis of exclusion, and requires a complete and thorough echocardiogram. It is not enough to make a diagnosis from a dilated left ventricle alone.
Dilated cardiomyopathy has been rare in domestic cats since its link with a taurine-deficient diet was discovered and rectified. Many breeds of dog, however, remain strongly predisposed. While research continues on possible dietary links (Freeman et al., 2018), there is undeniably a strong genetic component, and with two main expressions of the disease identified: degenerative, marked by fatty infiltration of the cardiac muscle (similar to that seen in ARVC), and ‘attenuated wavy fibre’ form, which is thought to carry a better prognosis (Dukes-McEwan, 2003). Larger breeds are, in general, more predisposed to DCM, as are Cocker and Springer Spaniels.
As mentioned, diagnosing DCM requires not only making sure the key features of the disease are present, but also checking that other potential causes are absent. If you are not already confident performing a full echocardiogram and would like further training, just let us know. In the below article, I will focus on three key diagnostic and prognostic areas: left ventricular size, left ventricular systolic function, and left ventricular diastolic function. I will also touch on the implications of concomitant mitral regurgitation, as well as right ventricular dilatation and elevated pulmonary pressures.
Even when the left ventricle is clearly dilated just by visual inspection, it is good practice to quantify this to support your diagnosis and in order to have comparison data for future scans.
Measurements can be taken in B-mode from the right parasternal long axis or short axis. M-mode at short axis papillary muscle level (with the chordae of the mitral valve just coming into view) is also a popular method with veterinarians, despite M-mode having been shown by numerous authors to result in a consistent overestimation of dimensions. This is because many of the studies from which we draw our normal values were performed in the ‘old’ days of M-mode, and have not been repeated for a sufficient number of breeds in B-mode. This perpetuates the use of this outdated technique, despite its obvious limitations. I would advise getting into the habit of performing both B-mode and M-mode measurements, and consider disregarding M-mode when you are unable to get the left ventricle perfectly on-axis, with the interventricular septum and free wall perpendicular to your ultrasound beam.
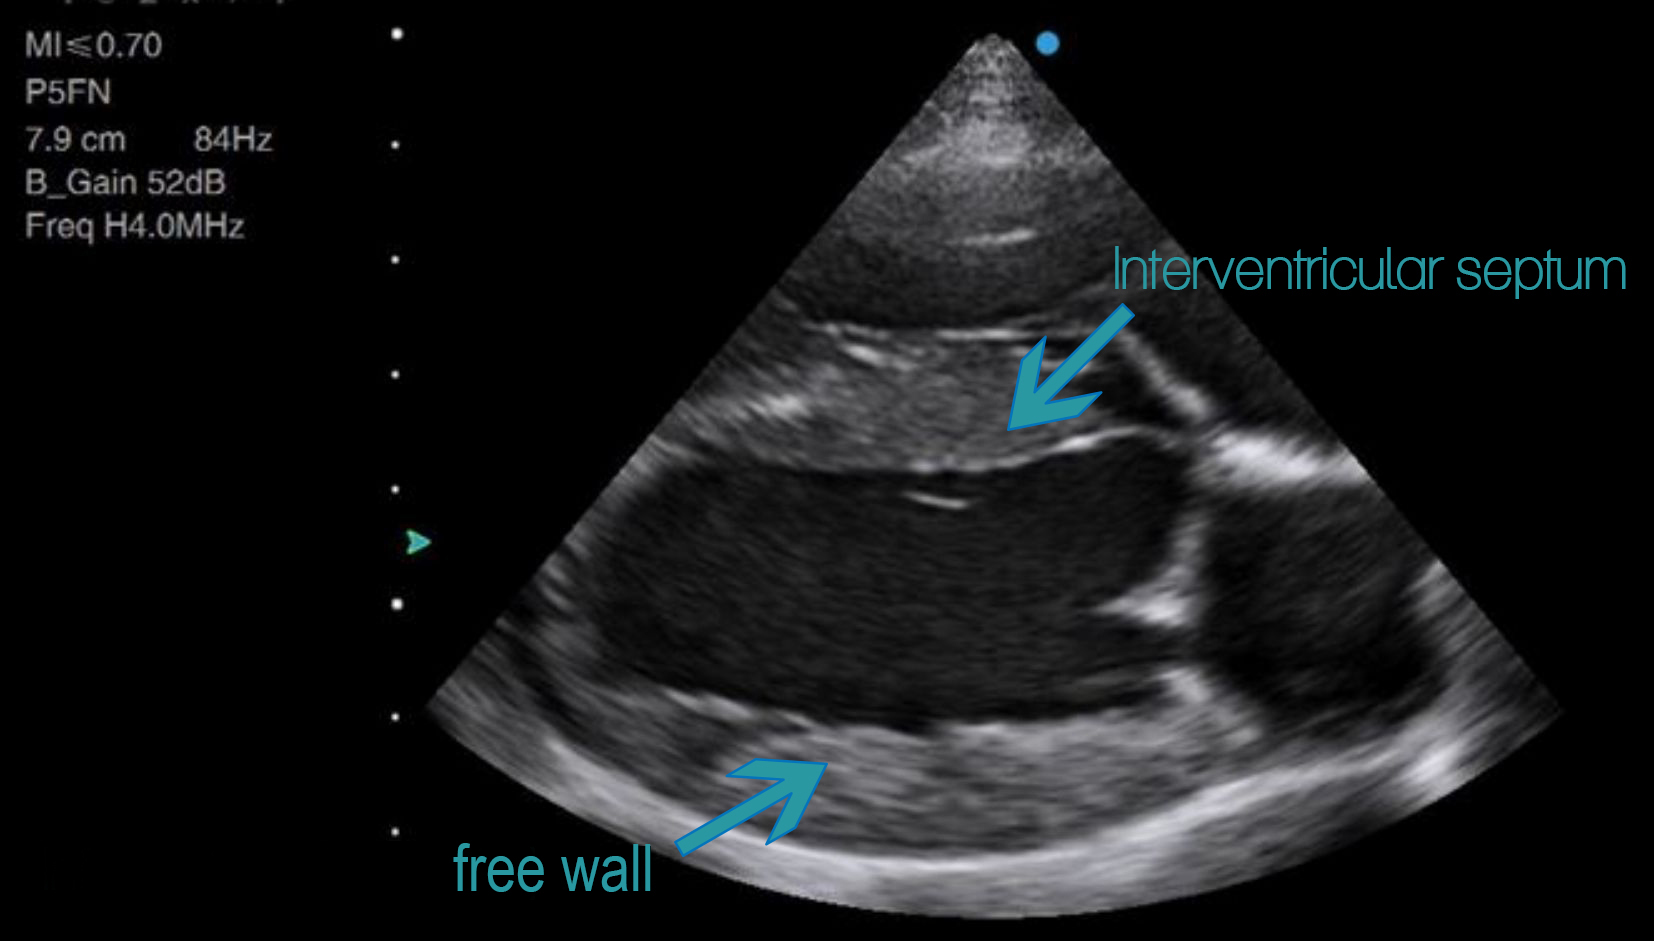
Above: Example of an on-axis long axis view. Note how the septum and free walls are perpendicular to the ultrasound beam. If you were to measure the cavity diameter, you could draw your line vertically down the screen and be at a perfect right angle to the chamber walls. This is what the M-mode beam does, so an M-mode measurement taken on this projection would give you the same result as a B-mode measurement.

Above: An off-axis long axis view. You can still accurately measure the LV cavity size with B-mode by ensuring that you measure at 90 degrees to the chamber walls. If running an M-mode beam down through this ventricle, however, you would be cutting it obliquely, thus leading to an overestimation in the cavity size. This can be just as easily done from the short-axis projection, where an off-axis cut can be even more difficult to see, except in extreme cases where you will create an ‘egg-shaped’ short axis. A perfectly on-axis image is always desirable, but not always achievable in clinical practice, which gives B-mode measurements a distinct advantage over M-mode.
Below, left ventricular dimensions are taken in a Cocker Spaniel from the right parasternal short axis in B-mode, first in diastole and then in systole. Even without indexing to body surface area, it is clear that this ventricle is severely dilated at 6.3cm in diastole and 5.7cm in systole. Normal values for body size are detailed in a paper by Cornell et al. (2004), albeit with M-mode data. The full paper title can be found in the references list at the bottom of the page.


The ‘gold standard’ for left ventricular volumes is Simpson’s method, and higher end ultrasound machines should have this within their cardiac package. It involves tracing around the endocardium at end diastole to obtain the diastolic volume, and end systole for systolic. This method requires a lot more practice than linear measurements in order to achieve proficiency.
Below is an example taken by a vet learning on the Siui Apogee 2300. The pros and cons of Simpson’s method are discussed in detail later, because it can also be used to assess systolic function.

A dilated left ventricle is your first step in diagnosing DCM, but interestingly, degree of dilatation is not as prognostic as other measures.
The degree of systolic impairment is far more prognostic than degree of dilatation (Borgarelli et al., 2006). A right parasternal long axis view in a Cocker Spaniel is shown below. Notice not only the huge size of the left ventricle, which occupies almost all of the imaging area, but also the poor contractility. The rhythm is also irregular.
Arrythmias are a common accompaniment to DCM – particularly atrial fibrillation. It is currently unclear which arrhythmias may or may not be predictive of DCM in certain breeds, but ventricular arrythmias have been shown to precede echocardiographic evidence of DCM in the Dobermann by several months or years (Calvert et al., 2000).
Systolic function can be estimated in a number of ways, and it is best to combine any measurement with your own visual judgement.
Fraction shortening is simply the end diastolic left ventricular cavity dimension minus the end systolic, divided by the end diastolic dimension. Most ultrasound machines will calculate this for you automatically. This is a very simple measure, taken along only one dimension, but can give a quick and easy indication in a globally impaired ventricle. In the Cocker Spaniel example with the ventricle measuring 6.3cm in diastole and 5.7cm in systole, the fractional shortening is only 10%, which indicates a severely impaired ventricle.
Calculating an ejection fraction involves tracing around the endocardium of the left ventricle in diastole and systole. If your machine has a full cardiac package, it will then automatically calculate the ejection fraction (EF) for you using Simpson’s method of disks. Most authors recommend attempting from both the right parasternal and left apical views, and selecting that which provides the greatest left ventricular length and volume. In my experience, the right parasternal view often loses the tip of the apex in diastole, and the left apical views frequently foreshorten the ventricle – so both methods require a lot of practice to become reproducible.
Experienced operators can undoubtedly avoid such problems, but similarly, visual estimates of EF by experienced operators have been shown to be highly correlated with calculated EF% (Gudmundsson et al., 2005). The real value of a quantified EF is therefore for the less experienced, yet these are the very same veterinarians who will likely struggle to obtain the optimal image. Future technologies based around auto EF, machine learning and 3D echocardiography will offer solutions to these problems, but are not yet viable in the veterinary market. Until then, there’s simply no substitute for practice, and exposing yourself to as many video clips as possible until you start to get a feel for what normal contraction looks like.
It is worth noting that both fractional shortening and, to a slightly lesser degree ejection fraction, can be misleading where there is concomitant significant regurgitation (and functional mitral regurgitation is not uncommon where the left ventricle is dilated), and should always be interpreted in context. If systolic function is anything less than hyperdynamic in the presence of severe regurgitation, then it is impaired.
One other clue that there is underlying systolic dysfunction where there is significant mitral regurgitation is given by the peak velocity of the regurgitant jet from your continuous wave Doppler. Since mitral regurgitation occurs during ventricular systole, its peak velocity represents the contractile force of the ventricle, except in extreme cases (such as free-flow mitral regurgitation where left atrial pressures are severely elevated). A normal ventricle should be forcing blood through the regurgitant orifice at around 6m/s. In the below example, note how the peak velocity of the mitral regurgitant jet is just under 5m/s, indicating underlying systolic dysfunction.

Tip: Severe primary mitral regurgitation can cause left ventricular dilatation and, eventually, systolic impairment; DCM can cause mitral annular dilatation and, occasionally, severe functional regurgitation. In order to determine which came first, look carefully at the mitral valve leaflets. If the mitral regurgitation is secondary to a dilated and impaired left ventricle, the leaflets themselves will be structurally normal.
In Newsletter 2, David Dawson presented a tutorial on the basics of assessing diastolic function with Pulsed Wave and Tissue Doppler Imaging (TDI). A number of authors have demonstrated that diastolic function is a strong prognostic indicator in animals with DCM, with a restrictive filling pattern indicating a poor prognosis (Borgarelli et al., 2006). A mitral inflow pattern with a sharp E wave deceleration time and a diminutive A wave indicates restrictive filling, and this is confirmed by the presence of low E’ velocities on TDI. Even in the presence of atrial fibrillation, a short E wave deceleration time is in itself a strong prognostic indicator of poor prognosis in the presence of left ventricular systolic dysfunction, even if the patient is asymptomatic (Dukes-McEwan et al., 2008). This highlights the vital importance of using your pulsed wave Doppler capabilities when assessing a patient with DCM.
At this late stage of the disease, DCM will likely be accompanied by some degree of pulmonary hypertension, right ventricular dysfunction and ascites, all of which are negative prognostic indicators. Assessing pulmonary pressures with continuous wave Doppler has been previously discussed here.
Have you come across DCM recently in your practice? Did you take any other views or measurements not mentioned above? Please reply to your newsletter email to share your stories!
References
Abazid, R., Abohamr, S., Smettei, O., et al. (2018). Visual versus fully automated assessment of left ventricular ejection fraction. Avicenna J Med, 8(2).
Borgarelli, M., Santilli, R., Chiavegato, D., et al. (2006). Prognostic Indicators for Dogs with Dilated Cardiomyopathy. J Vet Intern Med 20:104-110.
Calvert, C., Jacobs, G., Smith D., et al. (2000). Association between results of ambulatory electrocardiography and development of cardiomyopathy during long-term follow-up of Doberman pinschers. J Am Vet Med Assoc, 216(34-39).
Cornell, C., Kittleson, M., Torre, P. et al. (2004). Allometric Scaling of M-Mode Cardiac Measurements in Normal Adult Dogs. J Vet Intern Med, 18:311-321.
Dukes-McEwan, J., Borgarelli, M., Tidholm, A., et al. (2008). Proposed Guidelines for the Diagnosis of Canine Idiopathic Dilated Cardiomyopathy. Journal of Veterinary Cardiology, Vol 5(2).
Freeman, L., Stern, J., Fries, R., et al. (2018). Diet-associated dilated cardiomyopathy in dogs: what do we know? JAVMA, 253(11).
Gudmundsson, P., Rydberg, E., Winter, R., Willenheimer, R. (2005). Visually estimated left ventricular ejection fraction by echocardiography is closely correlated with formal quantitative methods. Int J Cardiol.
Holler, P., Wess, G. (2014). Sphericity index and E-point-to-septal-separation (EPSS) to diagnose dilated cardiomyopathy in Doberman Pinschers. J Vet Intern Med, 28(1).