I met with one of my RVC colleagues last week in preparation for a trip to London Zoo to see a silverback gorilla (him doing the ECG, and I the echocardiogram). As we planned our approach, we discussed the differences between human and veterinary echocardiography and the ways in which great apes straddle both specialties. Echo views in gorillas are almost identical to humans, but due to their size (the one we are scanning is 172kg), they cannot be rolled onto their side as we would do to a person – or indeed a dog or cat. They have to be scanned flat on their backs, which presents new challenges in terms of finding good acoustic windows.
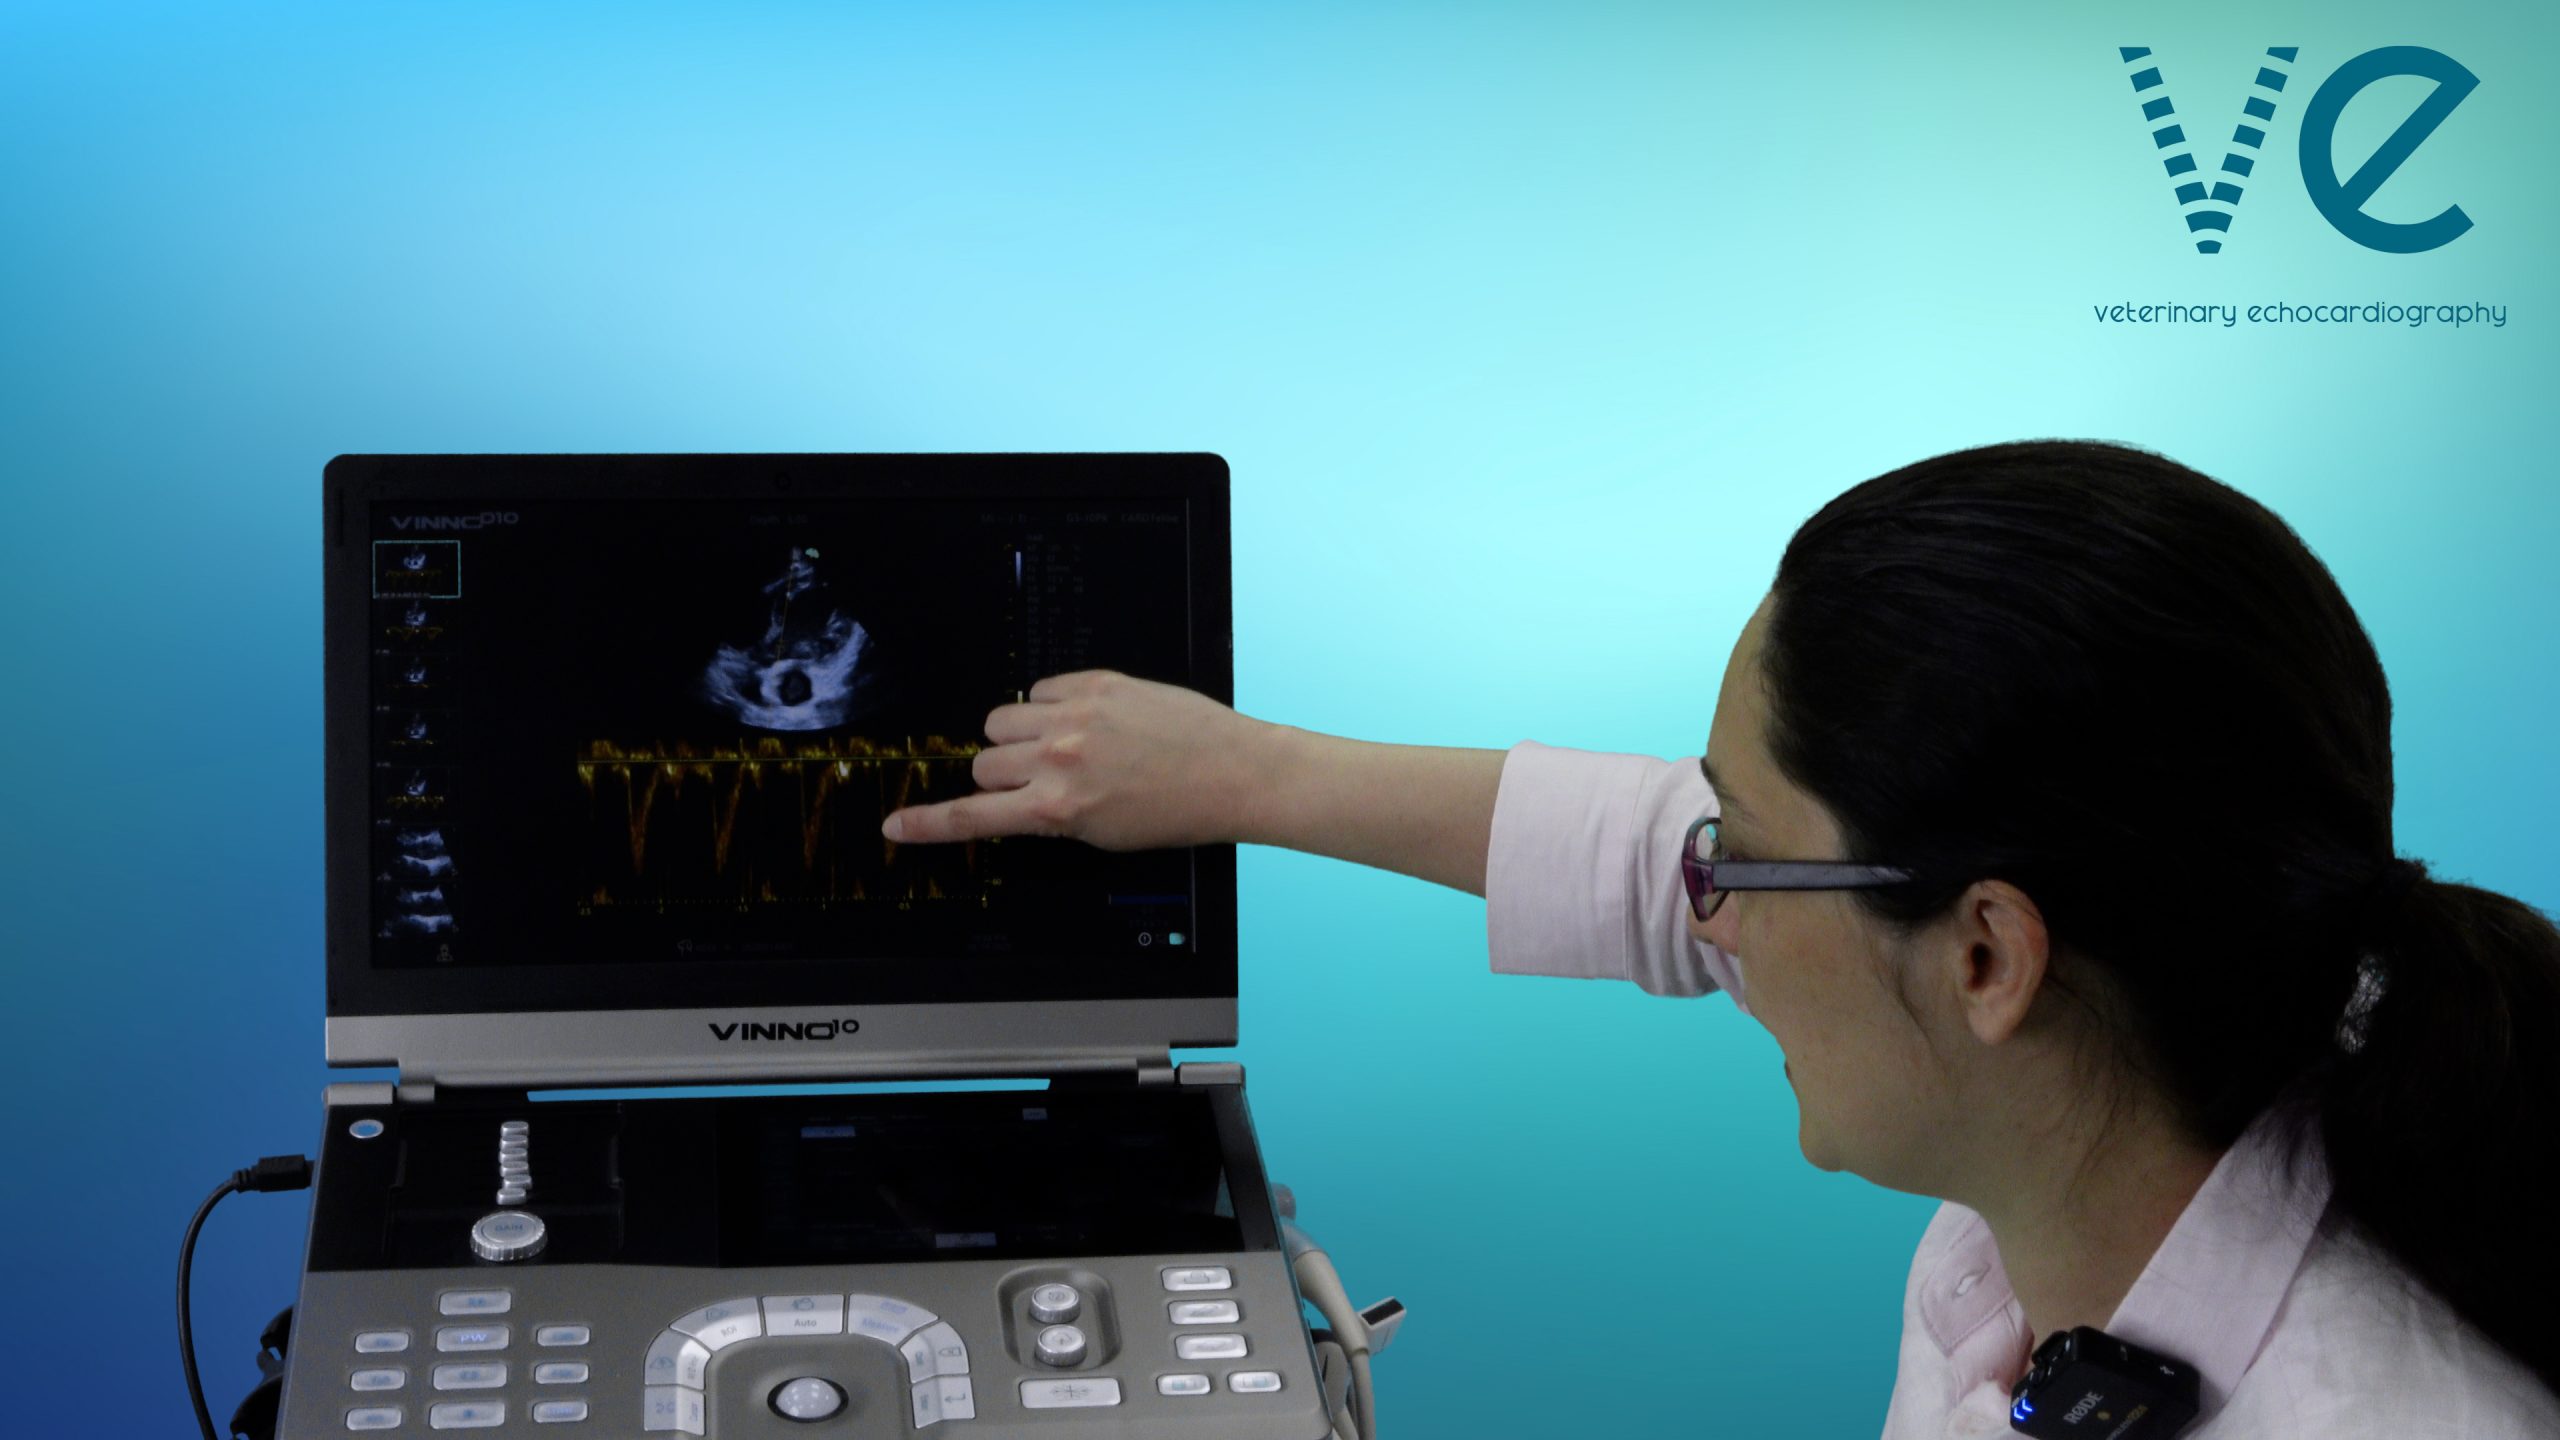
I noted that the gorilla echo protocol requires a pulse wave Doppler trace to be taken in the left ventricular outflow tract (LVOT) from the apical 5 chamber view, in contrast to the approach taken by a lot of small animal veterinarians, who frequently skip an LVOT trace altogether, yet choose pulse wave Doppler for their aortic trace instead. I have always found this curious (as it eliminates one’s ability to compare velocities before and after the valve) and wondered about why this has become the standard for so many in veterinary medicine. I suspect that the reasons are:
(a) Valvular aortic stenosis in animals is very rare, which has meant that the importance of measuring the velocity before and after the valve is much reduced in comparison with human medicine.
(b) The reason why pulse wave has become the spectral Doppler technique of choice (when, if you were to pick only one, continuous is surely so much easier?) is because, when echocardiography began to take off in veterinary medicine, a lot of veterinarians did not have machines with continuous wave Doppler. Even today, it remains a chargeable ‘add-on’ for many systems, and a phased array probe and cardiac software package is invariably a minimum requirement.
(c) The lack of guidelines to tell people otherwise has meant that people have developed their own protocols and standards, which have, at times, taken different directions to human medicine.
It will be interesting, when the new veterinary echocardiography guidelines are published, to see what the official recommendation is with regard to this.
In one of our monthly webinars in the Confidence in Echocardiography training programme, we discussed calculating regurgitant volumes using the continuity principle. For those unfamiliar with this technique, when used in patients with mitral regurgitation it involves calculating the volume of blood entering the left ventricle, and calculating the volume of blood leaving it. The difference between the two tells you (in theory!) what volume of blood is leaking backwards into the left atrium and never leaving the heart, thereby helping to grade severity.
Central to this calculation is the assumption that the left ventricular outflow tract is circular. The diameter is measured from the parasternal long-axis view in mid-systole, and converted into an area using πr² (this is described in more detail below). This is then paired with a PW Doppler trace taken at the same site in the outflow tract (but using the apical or subcostal view). One of our members, however, mentioned that she does not take her pulse wave Doppler tracing from the left ventricular outflow tract, and instead advances her sample gate past the valve and into the aorta. Her reasoning is that she feels – and, indeed, has collected evidence to support – that her VTI tracing from the LVOT always underestimate volumes. When she samples in the aorta, her calculations become more sensible.
While this is technically incorrect – one should measure and sample at the same site – in most patients, the potential inaccuracies of using different sampling sites will be negligible, though patients with any type of fixed or dynamic aortic stenosis or aortic regurgitation are notable and obvious exceptions. Therefore, our member’s approach of sampling in the aorta is unlikely to result in significant inaccuracies when she calculates regurgitant volumes using continuity, and the greater reproducibility she and her colleagues achieve with this method is likely to outweigh any other consideration. However, it was fascinating to hear, as yet another example of the heterogeneity of technique within veterinary echocardiography.
If you would like to learn the ‘textbook’ method for calculating cardiac output, take a look at the videos below.
Step 1: Acquire cine loops optimised for the left ventricular outflow tract
Step 2: Measure the LVOT (this can also be done at the end of the exam)
Your machine will almost certainly do this for you, but the reason you are taking this measurement is so that you can calculate the cross-sectional area of the LVOT. If your patient’s LVOT diameter is 0.64cm, then you can calculate the cross-sectional area using πr². Since you have the diameter (twice the radius), you’ll just divide that by two, so your calculation is:
CSA = π × (D/2)²
In this example, my patient’s LVOT cross-sectional area is π(0.32)² = 0.32cm.
Step 3: Obtain your LVOT trace
Step 4: Trace your LVOT envelope to get the velocity time integral (VTI)
This can be painful to do by hand; I now rely on our automated reporting software, Quantum, to do it for me. Unlike on-system automated solutions, this is based on artificial intelligence trained on the tracings of expert echocardiographers and cardiologists, so it tends not to overestimate in the way that vendor’s onboard automated tracings do. The short clip below shows how it looks when performed manually.
Step 5: Calculate stroke volume and cardiac output
Now that you have the VTI and cross-sectional area, you can calculate stroke volume, because stroke volume = LVOT cross-sectional area x LVOT VTI. Your answer will be in ml.
If you want to convert this to cardiac output, simply multiply this by your patient’s heart rate, since cardiac output = stroke volume x heart rate.
Sign up to our free monthly echocardiography newsletter here!
Or if you are ready to take your echo to the next level with RACE-approved CE and lifelong mentorship, book a call here to discuss where you’re currently at with your echo and find out whether you will be a good fit for our training programme.
© 2025 | AUA – All Rights Reserved